
一、 创建对象
可以通过 Data Structure Intro Setion 来查看有关该节内容的详细信息。
1、可以通过传递一个list对象来创建一个Series,pandas会默认创建整型索引:

2、通过传递一个numpy array,时间索引以及列标签来创建一个DataFrame:
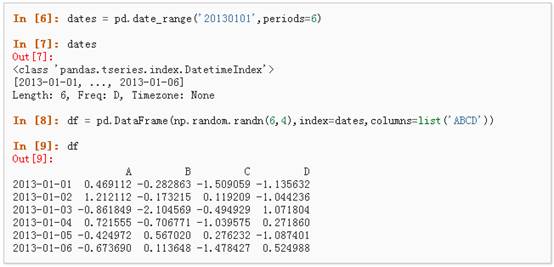
3、通过传递一个能够被转换成类似序列结构的字典对象来创建一个DataFrame:

4、查看不同列的数据类型:

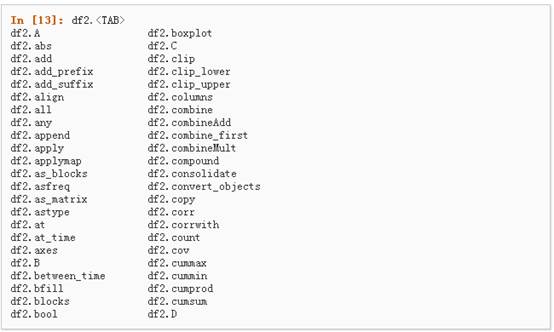
5、如果你使用的是IPython,使用Tab自动补全功能会自动识别所有的属性以及自定义的列,下图中是所有能够被自动识别的属性的一个子集:
二、 查看数据
详情请参阅:Basics Section
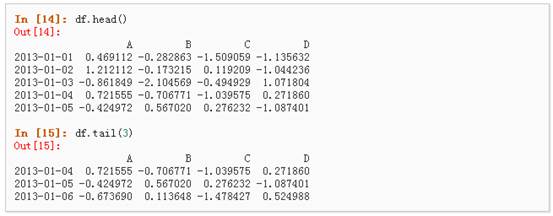
1、 查看frame中头部和尾部的行:
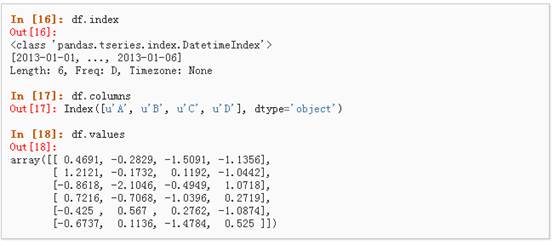
2、 显示索引、列和底层的numpy数据:
3、 describe()函数对于数据的快速统计汇总:

4、 对数据的转置:

5、 按轴进行排序

6、 按值进行排序

三、 选择
虽然标准的Python/Numpy的选择和设置表达式都能够直接派上用场,但是作为工程使用的代码,我们推荐使用经过优化的pandas数据访问方式:.at, .iat, .loc, .iloc 和 .ix详情请参阅Indexing and Selecing Data 和 MultiIndex / Advanced Indexing。
l 获取
1、 选择一个单独的列,这将会返回一个Series,等同于df.A:

2、 通过[]进行选择,这将会对行进行切片

l 通过标签选择
1、 使用标签来获取一个交叉的区域

2、 通过标签来在多个轴上进行选择

3、 标签切片

4、 对于返回的对象进行维度缩减

5、 获取一个标量

6、 快速访问一个标量(与上一个方法等价)

l 通过位置选择
1、 通过传递数值进行位置选择(选择的是行)

2、 通过数值进行切片,与numpy/python中的情况类似

3、 通过指定一个位置的列表,与numpy/python中的情况类似

4、 对行进行切片

5、 对列进行切片

6、 获取特定的值

l 布尔索引
1、 使用一个单独列的值来选择数据:

2、 使用where操作来选择数据:

3、 使用isin()方法来过滤:

l 设置
1、 设置一个新的列:
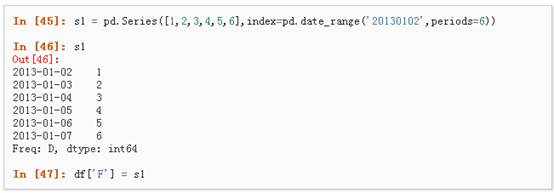
2、 通过标签设置新的值:

3、 通过位置设置新的值:

4、 通过一个numpy数组设置一组新值:

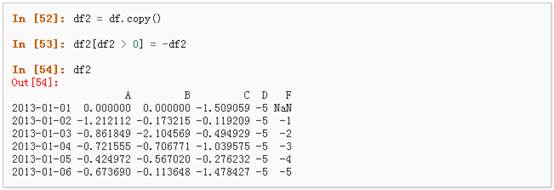
上述操作结果如下:

5、 通过where操作来设置新的值:
四、 缺失值处理
在pandas中,使用np.nan来代替缺失值,这些值将默认不会包含在计算中,详情请参阅:Missing Data Section。
1、 reindex()方法可以对指定轴上的索引进行改变/增加/删除操作,这将返回原始数据的一个拷贝:、

2、 去掉包含缺失值的行:

3、 对缺失值进行填充:

4、 对数据进行布尔填充:

五、 相关操作
详情请参与 Basic Section On Binary Ops
l 统计(相关操作通常情况下不包括缺失值)
1、 执行描述性统计:

2、 在其他轴上进行相同的操作:

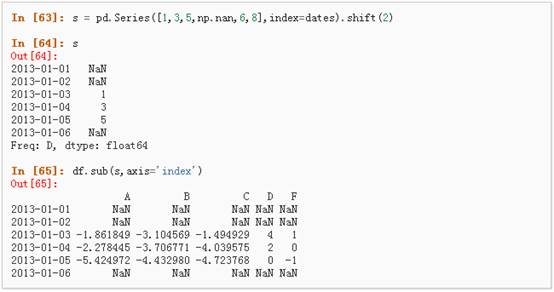
3、 对于拥有不同维度,需要对齐的对象进行操作。Pandas会自动的沿着指定的维度进行广播:
l Apply
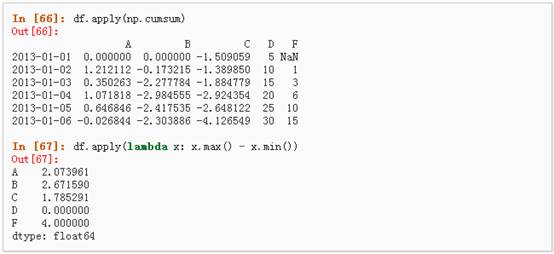
1、 对数据应用函数:
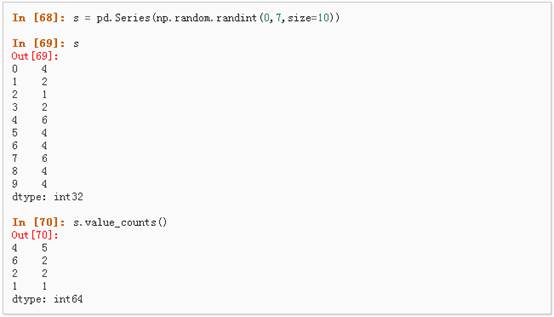
l 直方图
具体请参照:Histogramming and Discretization
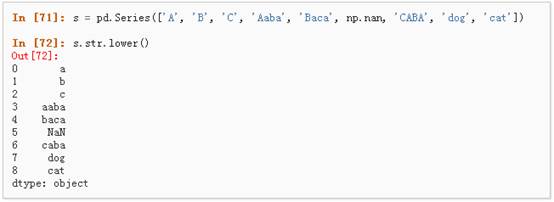
l 字符串方法
Series对象在其str属性中配备了一组字符串处理方法,可以很容易的应用到数组中的每个元素,如下段代码所示。更多详情请参考:Vectorized String Methods.
六、 合并
Pandas提供了大量的方法能够轻松的对Series,DataFrame和Panel对象进行各种符合各种逻辑关系的合并操作。具体请参阅:Merging section
l Concat

l Join 类似于SQL类型的合并,具体请参阅:Database style joining

l Append 将一行连接到一个DataFrame上,具体请参阅Appending:

七、 分组
对于”group by”操作,我们通常是指以下一个或多个操作步骤:
l (Splitting)按照一些规则将数据分为不同的组;
l (Applying)对于每组数据分别执行一个函数;
l (Combining)将结果组合到一个数据结构中;
详情请参阅:Grouping section
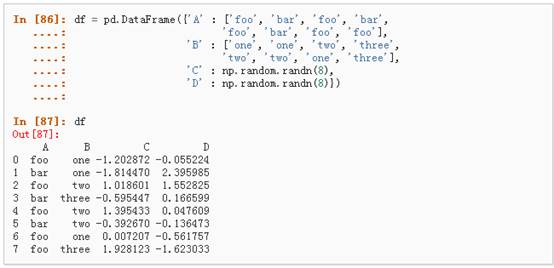
1、 分组并对每个分组执行sum函数:

2、 通过多个列进行分组形成一个层次索引,然后执行函数:

八、 Reshaping
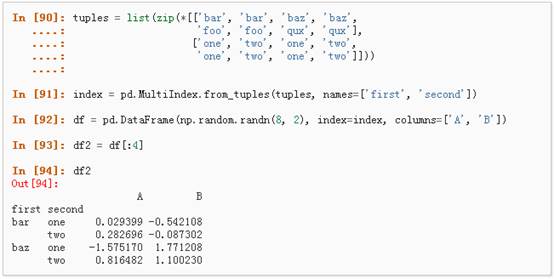
详情请参阅 Hierarchical Indexing 和 Reshaping。
l Stack
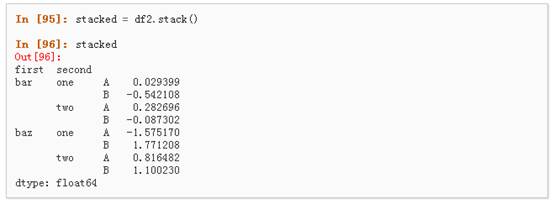
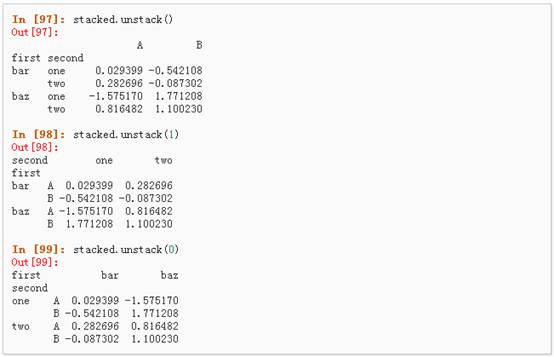
l 数据透视表,详情请参阅:Pivot Tables.
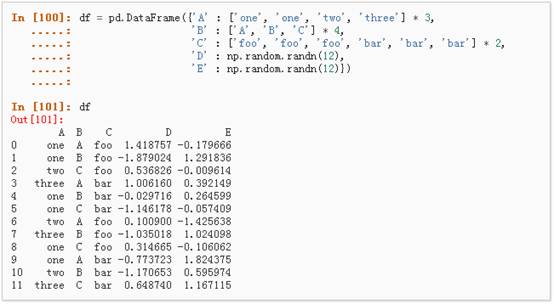
可以从这个数据中轻松的生成数据透视表:
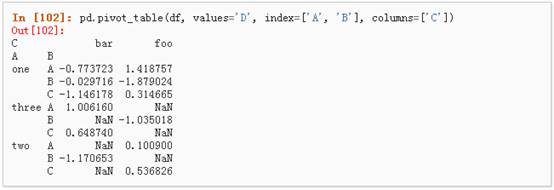
九、 时间序列
Pandas在对频率转换进行重新采样时拥有简单、强大且高效的功能(如将按秒采样的数据转换为按5分钟为单位进行采样的数据)。这种操作在金融领域非常常见。具体参考:Time Series section。

1、 时区表示:
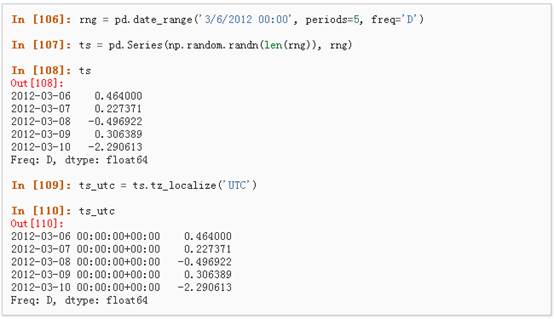
2、 时区转换:

3、 时间跨度转换:
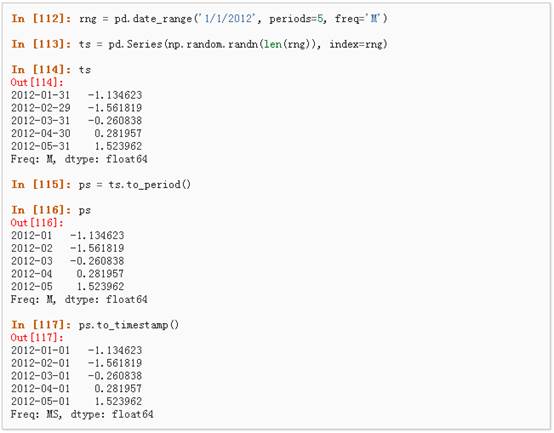
4、 时期和时间戳之间的转换使得可以使用一些方便的算术函数。

十、 Categorical
从0.15版本开始,pandas可以在DataFrame中支持Categorical类型的数据,详细 介绍参看:categorical introduction和API documentation。

1、 将原始的grade转换为Categorical数据类型:

2、 将Categorical类型数据重命名为更有意义的名称:

3、 对类别进行重新排序,增加缺失的类别:
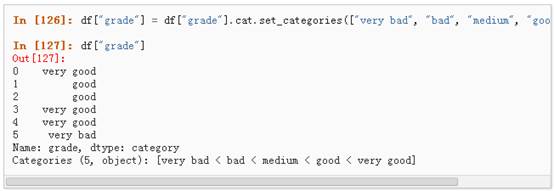
4、 排序是按照Categorical的顺序进行的而不是按照字典顺序进行:

5、 对Categorical列进行排序时存在空的类别:

十一、 画图
具体文档参看:Plotting docs
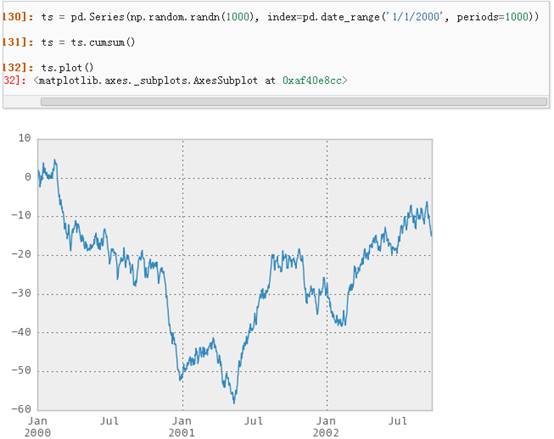
对于DataFrame来说,plot是一种将所有列及其标签进行绘制的简便方法:


十二、 导入和保存数据
l CSV,参考:Writing to a csv file
1、 写入csv文件:

2、 从csv文件中读取:
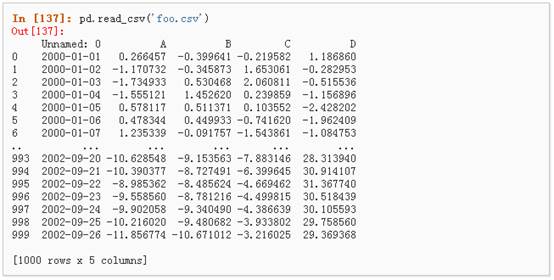
l HDF5,参考:HDFStores
1、 写入HDF5存储:

2、 从HDF5存储中读取:

l Excel,参考:MS Excel
1、 写入excel文件:

2、 从excel文件中读取:
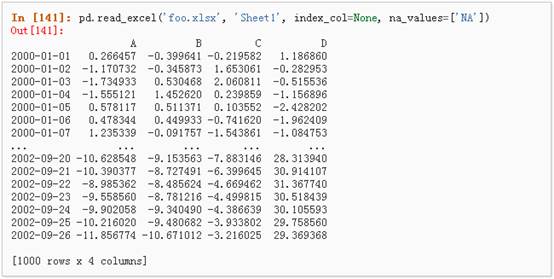
Introduction
Python is fast becoming the preferred language for data scientists – and for good reasons. It provides the larger ecosystem of a programming language and the depth of good scientific computation libraries. If you are starting to learn Python, have a look at learning path on Python.
Among its scientific computation libraries, I found Pandas to be the most useful for data science operations. Pandas, along with Scikit-learn provides almost the entire stack needed by a data scientist. This article focuses on providing 12 ways for data manipulation in Python. I’ve also shared some tips & tricks which will allow you to work faster.
I would recommend that you look at the codes for data exploration before going ahead. To help you understand better, I’ve taken a data set to perform these operations and manipulations.
Data Set: I’ve used the data set of Loan Prediction problem. Download the data set and get started.
Let’s get started
I’ll start by importing modules and loading the data set into Python environment:
import pandas as pd
import numpy as np
data = pd.read_csv("train.csv", index_col="Loan_ID")
#1 – Boolean Indexing
What do you do, if you want to filter values of a column based on conditions from another set of columns? For instance, we want a list of all females who are not graduate and got a loan. Boolean indexing can help here. You can use the following code:
data.loc[(data["Gender"]=="Female") & (data["Education"]=="Not Graduate") & (data["Loan_Status"]=="Y"), ["Gender","Education","Loan_Status"]]
#2 – Apply Function
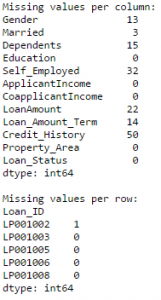
It is one of the commonly used functions for playing with data and creating new variables. Applyreturns some value after passing each row/column of a data frame with some function. The function can be both default or user-defined. For instance, here it can be used to find the #missing values in each row and column.
#Create a new function:
def num_missing(x):
  return sum(x.isnull())

#Applying per column:
print "Missing values per column:"
print data.apply(num_missing, axis=0) #axis=0 defines that function is to be applied on each column

#Applying per row:
print "nMissing values per row:"
print data.apply(num_missing, axis=1).head() #axis=1 defines that function is to be applied on each row
Thus we get the desired result.
Note: head() function is used in second output because it contains many rows.
Read More: Pandas Reference (apply)
#3 – Imputing missing files
‘fillna()’ does it in one go. It is used for updating missing values with the overall mean/mode/median of the column. Let’s impute the ‘Gender’, ‘Married’ and ‘Self_Employed’ columns with their respective modes.
#First we import a function to determine the mode
from scipy.stats import mode
mode(data['Gender'])
Output: ModeResult(mode=array([‘Male’], dtype=object), count=array([489]))
This returns both mode and count. Remember that mode can be an array as there can be multiple values with high frequency. We will take the first one by default always using:
mode(data['Gender']).mode[0]
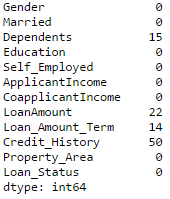
Now we can fill the missing values and check using technique #2.
#Impute the values:
data['Gender'].fillna(mode(data['Gender']).mode[0], inplace=True)
data['Married'].fillna(mode(data['Married']).mode[0], inplace=True)
data['Self_Employed'].fillna(mode(data['Self_Employed']).mode[0], inplace=True)

#Now check the #missing values again to confirm:
print data.apply(num_missing, axis=0)
Hence, it is confirmed that missing values are imputed. Please note that this is the most primitive form of imputation. Other sophisticated techniques include modeling the missing values, using grouped averages (mean/mode/median). I’ll cover that part in my next articles.
Read More: Pandas Reference (fillna)
#4 – Pivot Table
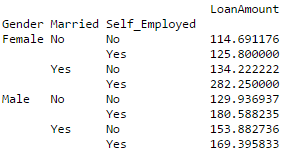
Pandas can be used to create MS Excel style pivot tables. For instance, in this case, a key column is “LoanAmount” which has missing values. We can impute it using mean amount of each ‘Gender’, ‘Married’ and ‘Self_Employed’ group. The mean ‘LoanAmount’ of each group can be determined as:
#Determine pivot table
impute_grps = data.pivot_table(values=["LoanAmount"], index=["Gender","Married","Self_Employed"], aggfunc=np.mean)
print impute_grps
More: Pandas Reference (Pivot Table)
#5 – Multi-Indexing
If you notice the output of step #3, it has a strange property. Each index is made up of a combination of 3 values. This is called Multi-Indexing. It helps in performing operations really fast.
Continuing the example from #3, we have the values for each group but they have not been imputed.
This can be done using the various techniques learned till now.
#iterate only through rows with missing LoanAmount
for i,row in data.loc[data['LoanAmount'].isnull(),:].iterrows():
  ind = tuple([row['Gender'],row['Married'],row['Self_Employed']])
  data.loc[i,'LoanAmount'] = impute_grps.loc[ind].values[0]

#Now check the #missing values again to confirm:
print data.apply(num_missing, axis=0)
Note:
- Multi-index requires tuple for defining groups of indices in loc statement. This a tuple used in function.
- The .values[0] suffix is required because, by default a series element is returned which has an index not matching with that of the dataframe. In this case, a direct assignment gives an error.
#6. Crosstab
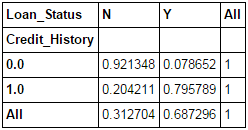
This function is used to get an initial “feel” (view) of the data. Here, we can validate some basic hypothesis. For instance, in this case, “Credit_History” is expected to affect the loan status significantly. This can be tested using cross-tabulation as shown below:
pd.crosstab(data["Credit_History"],data["Loan_Status"],margins=True)
These are absolute numbers. But, percentages can be more intuitive in making some quick insights. We can do this using the apply function:
def percConvert(ser):
  return ser/float(ser[-1])
  pd.crosstab(data["Credit_History"],data["Loan_Status"],margins=True).apply(percConvert, axis=1)
Now, it is evident that people with a credit history have much higher chances of getting a loan as 80% people with credit history got a loan as compared to only 9% without credit history.
But that’s not it. It tells an interesting story. Since I know that having a credit history is super important, what if I predict loan status to be Y for ones with credit history and N otherwise. Surprisingly, we’ll be right 82+378=460 times out of 614 which is a whopping 75%!
I won’t blame you if you’re wondering why the hell do we need statistical models. But trust me, increasing the accuracy by even 0.001% beyond this mark is a challenging task. Would you take this challenge?
Note: 75% is on train set. The test set will be slightly different but close. Also, I hope this gives some intuition into why even a 0.05% increase in accuracy can result in jump of 500 ranks on the Kaggle leaderboard.
Read More: Pandas Reference (crosstab)
#7 – Merge DataFrames
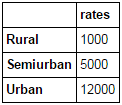
Merging dataframes become essential when we have information coming from different sources to be collated. Consider a hypothetical case where the average property rates (INR per sq meters) is available for different property types. Let’s define a dataframe as:
prop_rates = pd.DataFrame([1000, 5000, 12000], index=['Rural','Semiurban','Urban'],columns=['rates'])
prop_rates
Now we can merge this information with the original dataframe as:
data_merged = data.merge(right=prop_rates, how='inner',left_on='Property_Area',right_index=True, sort=False)
data_merged.pivot_table(values='Credit_History',index=['Property_Area','rates'], aggfunc=len)
The pivot table validates successful merge operation. Note that the ‘values’ argument is irrelevant here because we are simply counting the values.
ReadMore: Pandas Reference (merge)
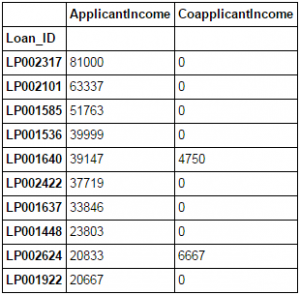
#8 – Sorting DataFrames
Pandas allow easy sorting based on multiple columns. This can be done as:
data_sorted = data.sort_values(['ApplicantIncome','CoapplicantIncome'], ascending=False)
data_sorted[['ApplicantIncome','CoapplicantIncome']].head(10)
Note: Pandas “sort” function is now deprecated. We should use “sort_values” instead.
More: Pandas Reference (sort_values)
#9 – Plotting (Boxplot & Histogram)
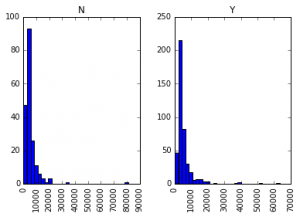
Many of you might be unaware that boxplots and histograms can be directly plotted in Pandas and calling matplotlib separately is not necessary. It’s just a 1-line command. For instance, if we want to compare the distribution of ApplicantIncome by Loan_Status:
import matplotlib.pyplot as plt
%matplotlib inline
data.boxplot(column="ApplicantIncome",by="Loan_Status")
data.hist(column="ApplicantIncome",by="Loan_Status",bins=30)
This shows that income is not a big deciding factor on its own as there is no appreciable difference between the people who received and were denied the loan.
Read More: Pandas Reference (hist) | Pandas Reference (boxplot)
#10 – Cut function for binning
Sometimes numerical values make more sense if clustered together. For example, if we’re trying to model traffic (#cars on road) with time of the day (minutes). The exact minute of an hour might not be that relevant for predicting traffic as compared to actual period of the day like “Morning”, “Afternoon”, “Evening”, “Night”, “Late Night”. Modeling traffic this way will be more intuitive and will avoid overfitting.
Here we define a simple function which can be re-used for binning any variable fairly easily.
#Binning:
def binning(col, cut_points, labels=None):
  #Define min and max values:
  minval = col.min()
  maxval = col.max()

  #create list by adding min and max to cut_points
  break_points = [minval] + cut_points + [maxval]

  #if no labels provided, use default labels 0 ... (n-1)
  if not labels:
    labels = range(len(cut_points)+1)

  #Binning using cut function of pandas
  colBin = pd.cut(col,bins=break_points,labels=labels,include_lowest=True)
  return colBin

#Binning age:
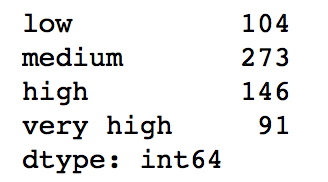
cut_points = [90,140,190]
labels = ["low","medium","high","very high"]
data["LoanAmount_Bin"] = binning(data["LoanAmount"], cut_points, labels)
print pd.value_counts(data["LoanAmount_Bin"], sort=False)
Read More: Pandas Reference (cut)
#11 – Coding nominal data
Often, we find a case where we’ve to modify the categories of a nominal variable. This can be due to various reasons:
- Some algorithms (like Logistic Regression) require all inputs to be numeric. So nominal variables are mostly coded as 0, 1….(n-1)
- Sometimes a category might be represented in 2 ways. For e.g. temperature might be recorded as “High”, “Medium”, “Low”, “H”, “low”. Here, both “High” and “H” refer to same category. Similarly, in “Low” and “low” there is only a difference of case. But, python would read them as different levels.
- Some categories might have very low frequencies and its generally a good idea to combine them.
Here I’ve defined a generic function which takes in input as a dictionary and codes the values using ‘replace’ function in Pandas.
#Define a generic function using Pandas replace function
def coding(col, codeDict):
  colCoded = pd.Series(col, copy=True)
  for key, value in codeDict.items():
    colCoded.replace(key, value, inplace=True)
  return colCoded

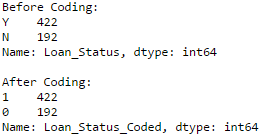
#Coding LoanStatus as Y=1, N=0:
print 'Before Coding:'
print pd.value_counts(data["Loan_Status"])
data["Loan_Status_Coded"] = coding(data["Loan_Status"], {'N':0,'Y':1})
print 'nAfter Coding:'
print pd.value_counts(data["Loan_Status_Coded"])
Similar counts before and after proves the coding.
Read More: Pandas Reference (replace)
#12 – Iterating over rows of a dataframe
This is not a frequently used operation. Still, you don’t want to get stuck. Right? At times you may need to iterate through all rows using a for loop. For instance, one common problem we face is the incorrect treatment of variables in Python. This generally happens when:
- Nominal variables with numeric categories are treated as numerical.
- Numeric variables with characters entered in one of the rows (due to a data error) are considered categorical.
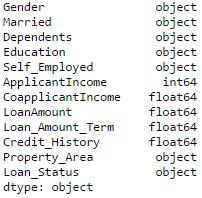
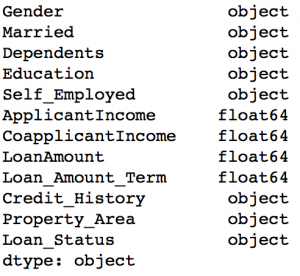
So it’s generally a good idea to manually define the column types. If we check the data types of all columns:
#Check current type:
data.dtypes
Here we see that Credit_History is a nominal variable but appearing as float. A good way to tackle such issues is to create a csv file with column names and types. This way, we can make a generic function to read the file and assign column data types. For instance, here I have created a csv file datatypes.csv.
#Load the file:
colTypes = pd.read_csv('datatypes.csv')
print colTypes
After loading this file, we can iterate through each row and assign the datatype using column ‘type’ to the variable name defined in the ‘feature’ column.
#Iterate through each row and assign variable type.
#Note: astype is used to assign types

for i, row in colTypes.iterrows():  #i: dataframe index; row: each row in series format
    if row['type']=="categorical":
        data[row['feature']]=data[row['feature']].astype(np.object)
    elif row['type']=="continuous":
        data[row['feature']]=data[row['feature']].astype(np.float)
print data.dtypes
Now the credit history column is modified to ‘object’ type which is used for representing nominal variables in Pandas.
Read More: Pandas Reference (iterrows)
End Notes
In this article, we covered various functions of Pandas which can make our life easy while performing data exploration and feature engineering. Also, we defined some generic functions which can be reused for achieving similar objective on different datasets.
Also See: If you have any doubts pertaining to Pandas or Python in general, feel free to discuss with us.
在数据分析领域,最热门的莫过于Python和R语言,此前有一篇文章《别老扯什么Hadoop了,你的数据根本不够大》指出:只有在超过5TB数据量的规模下,Hadoop才是一个合理的技术选择。这次拿到近亿条日志数据,千万级数据已经是关系型数据库的查询分析瓶颈,之前使用过Hadoop对大量文本进行分类,这次决定采用Python来处理数据:
- 硬件环境
- CPU:3.5 GHz Intel Core i7
- 内存:32 GB HDDR 3 1600 MHz
- 硬盘:3 TB Fusion Drive
- 数据分析工具
- Python:2.7.6
- Pandas:0.15.0
- IPython notebook:2.0.0
源数据如下表所示:
| Table | Size | Desc | |
|---|---|---|---|
| ServiceLogs | 98,706,832 rows x 14 columns | 8.77 GB | 交易日志数据,每个交易会话可以有多条交易 |
| ServiceCodes | 286 rows × 8 columns | 20 KB | 交易分类的字典表 |
数据读取
启动IPython notebook,加载pylab环境:
ipython notebook --pylab=inline
Pandas提供了IO工具可以将大文件分块读取,测试了一下性能,完整加载9800万条数据也只需要263秒左右,还是相当不错了。
import pandas as pd
reader = pd.read_csv('data/servicelogs', iterator=True)try:
    df = reader.get_chunk(100000000)except StopIteration:
    print "Iteration is stopped."
| 1百万条 | 1千万条 | 1亿条 | |
|---|---|---|---|
| ServiceLogs | 1 s | 17 s | 263 s |
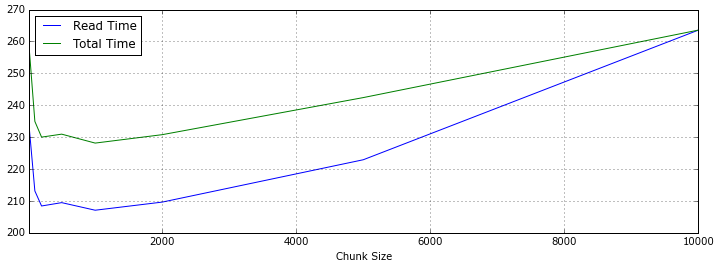
使用不同分块大小来读取再调用 pandas.concat 连接DataFrame,chunkSize设置在1000万条左右速度优化比较明显。
loop = True
chunkSize = 100000
chunks = []while loop:
    try:
        chunk = reader.get_chunk(chunkSize)
        chunks.append(chunk)
    except StopIteration:
        loop = False
        print "Iteration is stopped."
df = pd.concat(chunks, ignore_index=True)
下面是统计数据,Read Time是数据读取时间,Total Time是读取和Pandas进行concat操作的时间,根据数据总量来看,对5~50个DataFrame对象进行合并,性能表现比较好。
| Chunk Size | Read Time (s) | Total Time (s) | Performance |
|---|---|---|---|
| 100,000 | 224.418173 | 261.358521 | |
| 200,000 | 232.076794 | 256.674154 | |
| 1,000,000 | 213.128481 | 234.934142 | √ √ |
| 2,000,000 | 208.410618 | 230.006299 | √ √ √ |
| 5,000,000 | 209.460829 | 230.939319 | √ √ √ |
| 10,000,000 | 207.082081 | 228.135672 | √ √ √ √ |
| 20,000,000 | 209.628596 | 230.775713 | √ √ √ |
| 50,000,000 | 222.910643 | 242.405967 | |
| 100,000,000 | 263.574246 | 263.574246 |
如果使用Spark提供的Python Shell,同样编写Pandas加载数据,时间会短25秒左右,看来Spark对Python的内存使用都有优化。
数据清洗
Pandas提供了 DataFrame.describe 方法查看数据摘要,包括数据查看(默认共输出首尾60行数据)和行列统计。由于源数据通常包含一些空值甚至空列,会影响数据分析的时间和效率,在预览了数据摘要后,需要对这些无效数据进行处理。
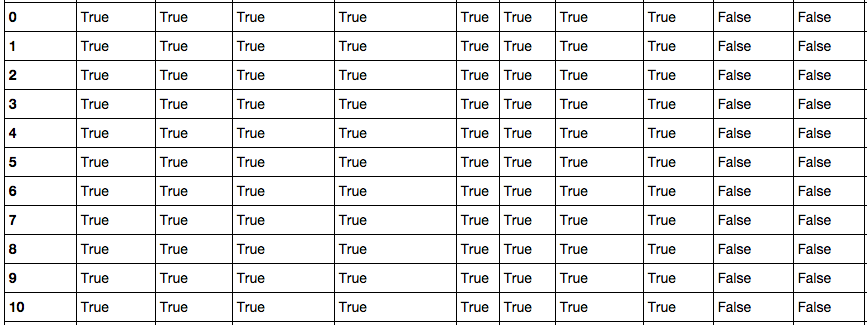
首先调用 DataFrame.isnull() 方法查看数据表中哪些为空值,与它相反的方法是 DataFrame.notnull() ,Pandas会将表中所有数据进行null计算,以True/False作为结果进行填充,如下图所示:
Pandas的非空计算速度很快,9800万数据也只需要28.7秒。得到初步信息之后,可以对表中空列进行移除操作。尝试了按列名依次计算获取非空列,和 DataFrame.dropna() 两种方式,时间分别为367.0秒和345.3秒,但检查时发现 dropna() 之后所有的行都没有了,查了Pandas手册,原来不加参数的情况下, dropna() 会移除所有包含空值的行。如果只想移除全部为空值的列,需要加上 axis 和 how 两个参数:
df.dropna(axis=1, how='all')
共移除了14列中的6列,时间也只消耗了85.9秒。
接下来是处理剩余行中的空值,经过测试,在 DataFrame.replace() 中使用空字符串,要比默认的空值NaN节省一些空间;但对整个CSV文件来说,空列只是多存了一个“,”,所以移除的9800万 x 6列也只省下了200M的空间。进一步的数据清洗还是在移除无用数据和合并上。
对数据列的丢弃,除无效值和需求规定之外,一些表自身的冗余列也需要在这个环节清理,比如说表中的流水号是某两个字段拼接、类型描述等,通过对这些数据的丢弃,新的数据文件大小为4.73GB,足足减少了4.04G!
数据处理
使用 DataFrame.dtypes 可以查看每列的数据类型,Pandas默认可以读出int和float64,其它的都处理为object,需要转换格式的一般为日期时间。DataFrame.astype() 方法可对整个DataFrame或某一列进行数据格式转换,支持Python和NumPy的数据类型。
df['Name'] = df['Name'].astype(np.datetime64)
对数据聚合,我测试了 DataFrame.groupby 和 DataFrame.pivot_table 以及 pandas.merge ,groupby 9800万行 x 3列的时间为99秒,连接表为26秒,生成透视表的速度更快,仅需5秒。
df.groupby(['NO','TIME','SVID']).count() # 分组
fullData = pd.merge(df, trancodeData)[['NO','SVID','TIME','CLASS','TYPE']] # 连接
actions = fullData.pivot_table('SVID', columns='TYPE', aggfunc='count') # 透视表
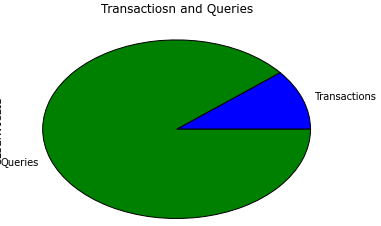
根据透视表生成的交易/查询比例饼图:
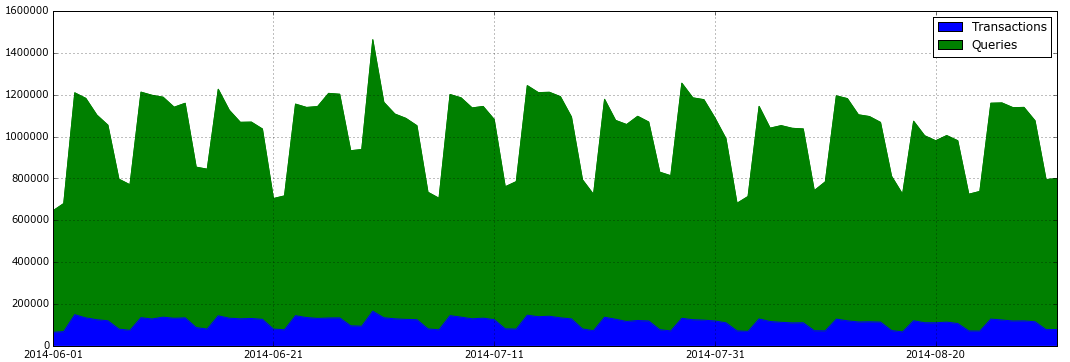
将日志时间加入透视表并输出每天的交易/查询比例图:
total_actions = fullData.pivot_table('SVID', index='TIME', columns='TYPE', aggfunc='count')
total_actions.plot(subplots=False, figsize=(18,6), kind='area')
除此之外,Pandas提供的DataFrame查询统计功能速度表现也非常优秀,7秒以内就可以查询生成所有类型为交易的数据子表:
tranData = fullData[fullData['Type'] == 'Transaction']
 同乐学堂
同乐学堂









 微信扫一扫,打赏作者吧~


